Have you ever wanted to temporarily edit a webpage to see how it would look with specific colors, fonts, styling, etc. It’s possible with a tool that already exists in your browser called Inspect Element. This is a dream come true for all DIY users when they find out about it. In this article, we will show you the basics of inspect element and how to use it with your WordPress site.
What is Inspect Element or Developer Tools?
Modern web browsers like Google Chrome and Mozilla Firefox has built-in tools which allow web developers to debug errors. These tools show the HTML, CSS, and JavaScript code for a page and how the browser executes the code.
Using Inspect Element tool, you can edit HTML, CSS, or JavaSCript code for any webpage and see your changes live (only on your computer).
For a DIY website owner, these tools can help you preview how a site design would look without actually making the changes for everyone.
For writers, these tools are awesome because you can easily change personal identifying information when taking your screenshots eliminating the need to blur out items altogether.
For support agents, it’s a great way to identify the error that could be causing your galleries to not load or your sliders to not work properly.
We’re just scratching the surface of use-cases. Inspect element is really powerful.
In this article, we will be focusing on Inspect Element in Google Chrome because that’s our browser of choice. Firefox has its own developer tools which can also be invoked by selecting inspect element from browser menu.
Ready? Let’s get started.
Video Tutorial
If you don’t like the video or need more instructions, then continue reading.
Launching Inspect Element and Locating The Code
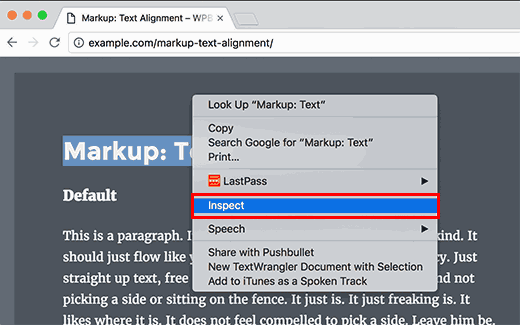
You can launch inspect element tool by pressing CTRL + Shift + I keys on your keyboard. Alternately you can click anywhere on a web page and select inspect element from browser menu.
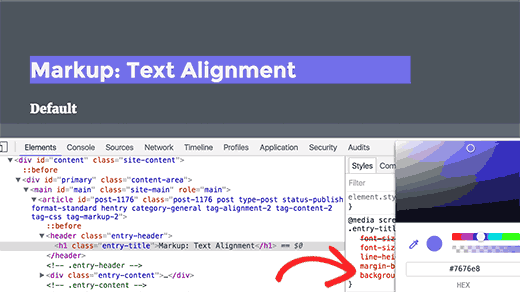
Your browser window will split into two, and the lower window will show the web page’s source code.
The developer tool window is further divided into two windows. On your left, you will see the HTML code for the page. On the right-hand pane, you will see the CSS rules.
As you move your mouse over the HTML source you will see the affected area highlighted on the web page. You will also notice CSS rules change to show the CSS for the element you are viewing.
You can also take the mouse pointer to an element on the web page, right click and select inspect element. The element you pointed at will be highlighted in the source code.
Editing and Debugging Code in Inspect Element
Both the HTML and CSS in the inspect element window are editable. You can double click anywhere in the HTML source code and edit the code as you like.
You can also double click and edit any attributes and styles in the CSS pane. To add a custom style rule click on the + icon at the top of CSS pane.
As you make changes to the CSS or HTML those changes will be reflected in the browser instantly.
Note, that any changes you make here are not saved anywhere. Inspect element is a debugging tool, and it does not write your changes back to the files on your server. This means that if you refresh the page, all your changes will be gone.
To actually make the changes, you will have to edit your WordPress theme’s stylesheet or relevant template to add the changes you want to save.
Before you start editing your existing WordPress theme using Inspect Element tool, make sure you that you save all your changes by creating a child theme.
Easily Find Errors On Your Site
Inspect element has an area called Console which shows all the errors that exist on your website. When trying to debug an error or requesting support from plugin authors, it’s always helpful to look here to see what the errors are.
For example, if you were an OptinMonster customer wondering why your optin is not loading, then you can easily find the problem “your page slug does not match”.
If your sharebar wasn’t working properly, then you can see that there’s a JavaScript error.
Tools like the Inspect Element Console and SupportAlly help you get better customer support because the technical support team love customers who take initiative in providing detailed feedback of the issue.
We hope this article helped you learn the basics of inspect element and how to use it with your WordPres site. You may also want to take a look at the default WordPress generated CSS cheat sheet to speed up your theme development skills.
If you liked this article, then please subscribe to our YouTube Channel for WordPress video tutorials. You can also find us on Twitter and Google+.
The post Basics of Inspect Element: Customizing WordPress for DIY Users appeared first on WPBeginner.


Aucun commentaire:
Enregistrer un commentaire